ehemalige Mitarbeiter
ehemalige Mitarbeiter

Ehem. Wissenschaftlicher Mitarbeiter
Hagen Tarner
- E-Mail:
- hagen.tarner (at) paluno.uni-due.de
- Homepage:
- https://hagen-tarner.de
- Autorenprofile:
- ORCID
- Google Scholar
- ResearchGate
Zur Person:
Nach einem Bachelor in Medizin Informatik und einem Master in Medieninformatik arbeite ich seit Mai 2018 an meiner Promotion auf dem Gebiet der Softwarevisualisierung.
Forschungsgebiete:
In meiner Forschung beschäftige ich mich hauptsächlich mit Themen der Informationsvisualisierung, wissenschaftlicher Visualisierung und Computergrafik.
Publikationen:
- Tarner, Hagen; Beck, Fabian: Visualizing Runtime Evolution Paths in a Multidimensional Space (Work In Progress Paper). In: Companion of the 2023 ACM/SPEC International Conference on Performance Engineering. ACM, Coimbra, Portugal, 2023. doi:10.1145/3578245.3585031KurzfassungPDFDetailsBIB Download
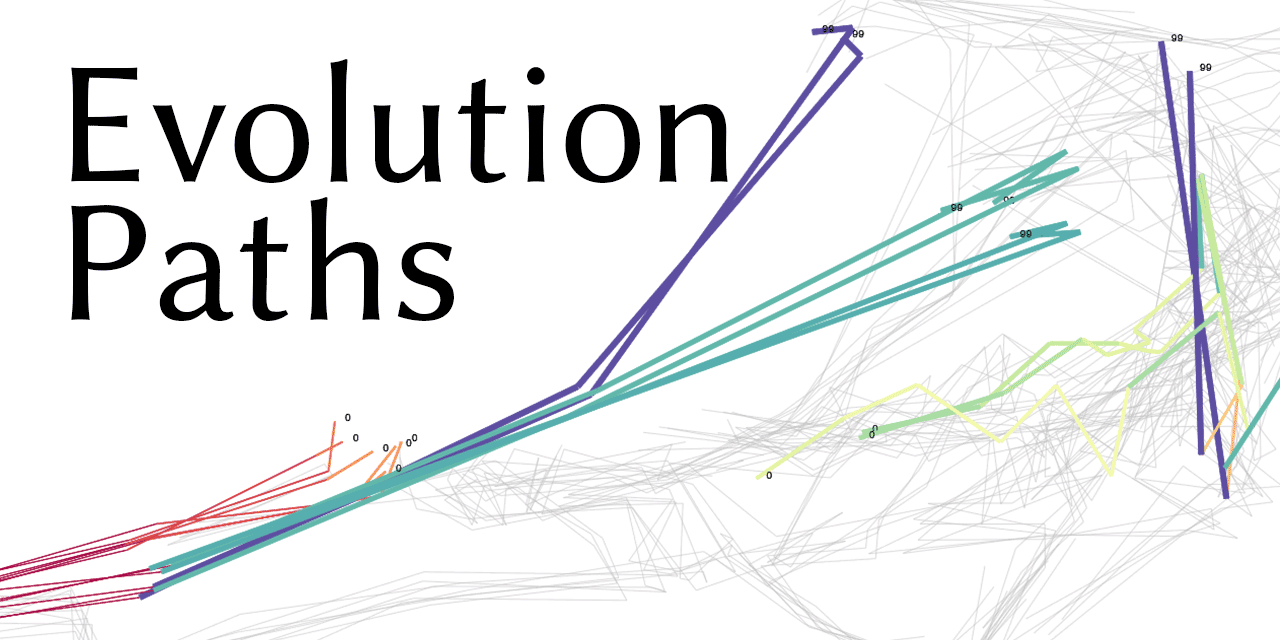
Runtime data of software systems is often of multivariate nature, describing different aspects of performance among other characteristics, and evolves along different versions or changes depending on the execution context. This poses a challenge for visualizations, which are typically only two- or three-dimensional. Using dimensionality reduction, we project the multivariate runtime data to 2D and visualize the result in a scatter plot. To show changes over time, we apply the projection to multiple timestamps and connect temporally adjacent points to form trajectories. This allows for cluster and outlier detection, analysis of co-evolution, and finding temporal patterns. While projected temporal trajectories have been applied to other domains before, we use it to visualize software evolution and execution context changes as evolution paths. We experiment with and report results of two application examples: (I) the runtime evolution along different versions of components from the Apache Commons project, and (II) a benchmark suite from scientific visualization comparing different rendering techniques along camera paths.
- Escobar, Ronald; Sandoval Alcocer, Juan Pablo; Tarner, Hagen; Beck, Fabian; Bergel, Alexandre: Spike – A code editor plugin highlighting fine-grained changes. In: Working Conference on Software Visualization (VISSOFT). Limassol, Cyprus, 2022. doi:10.1109/VISSOFT55257.2022.00026KurzfassungDetailsBIB Download
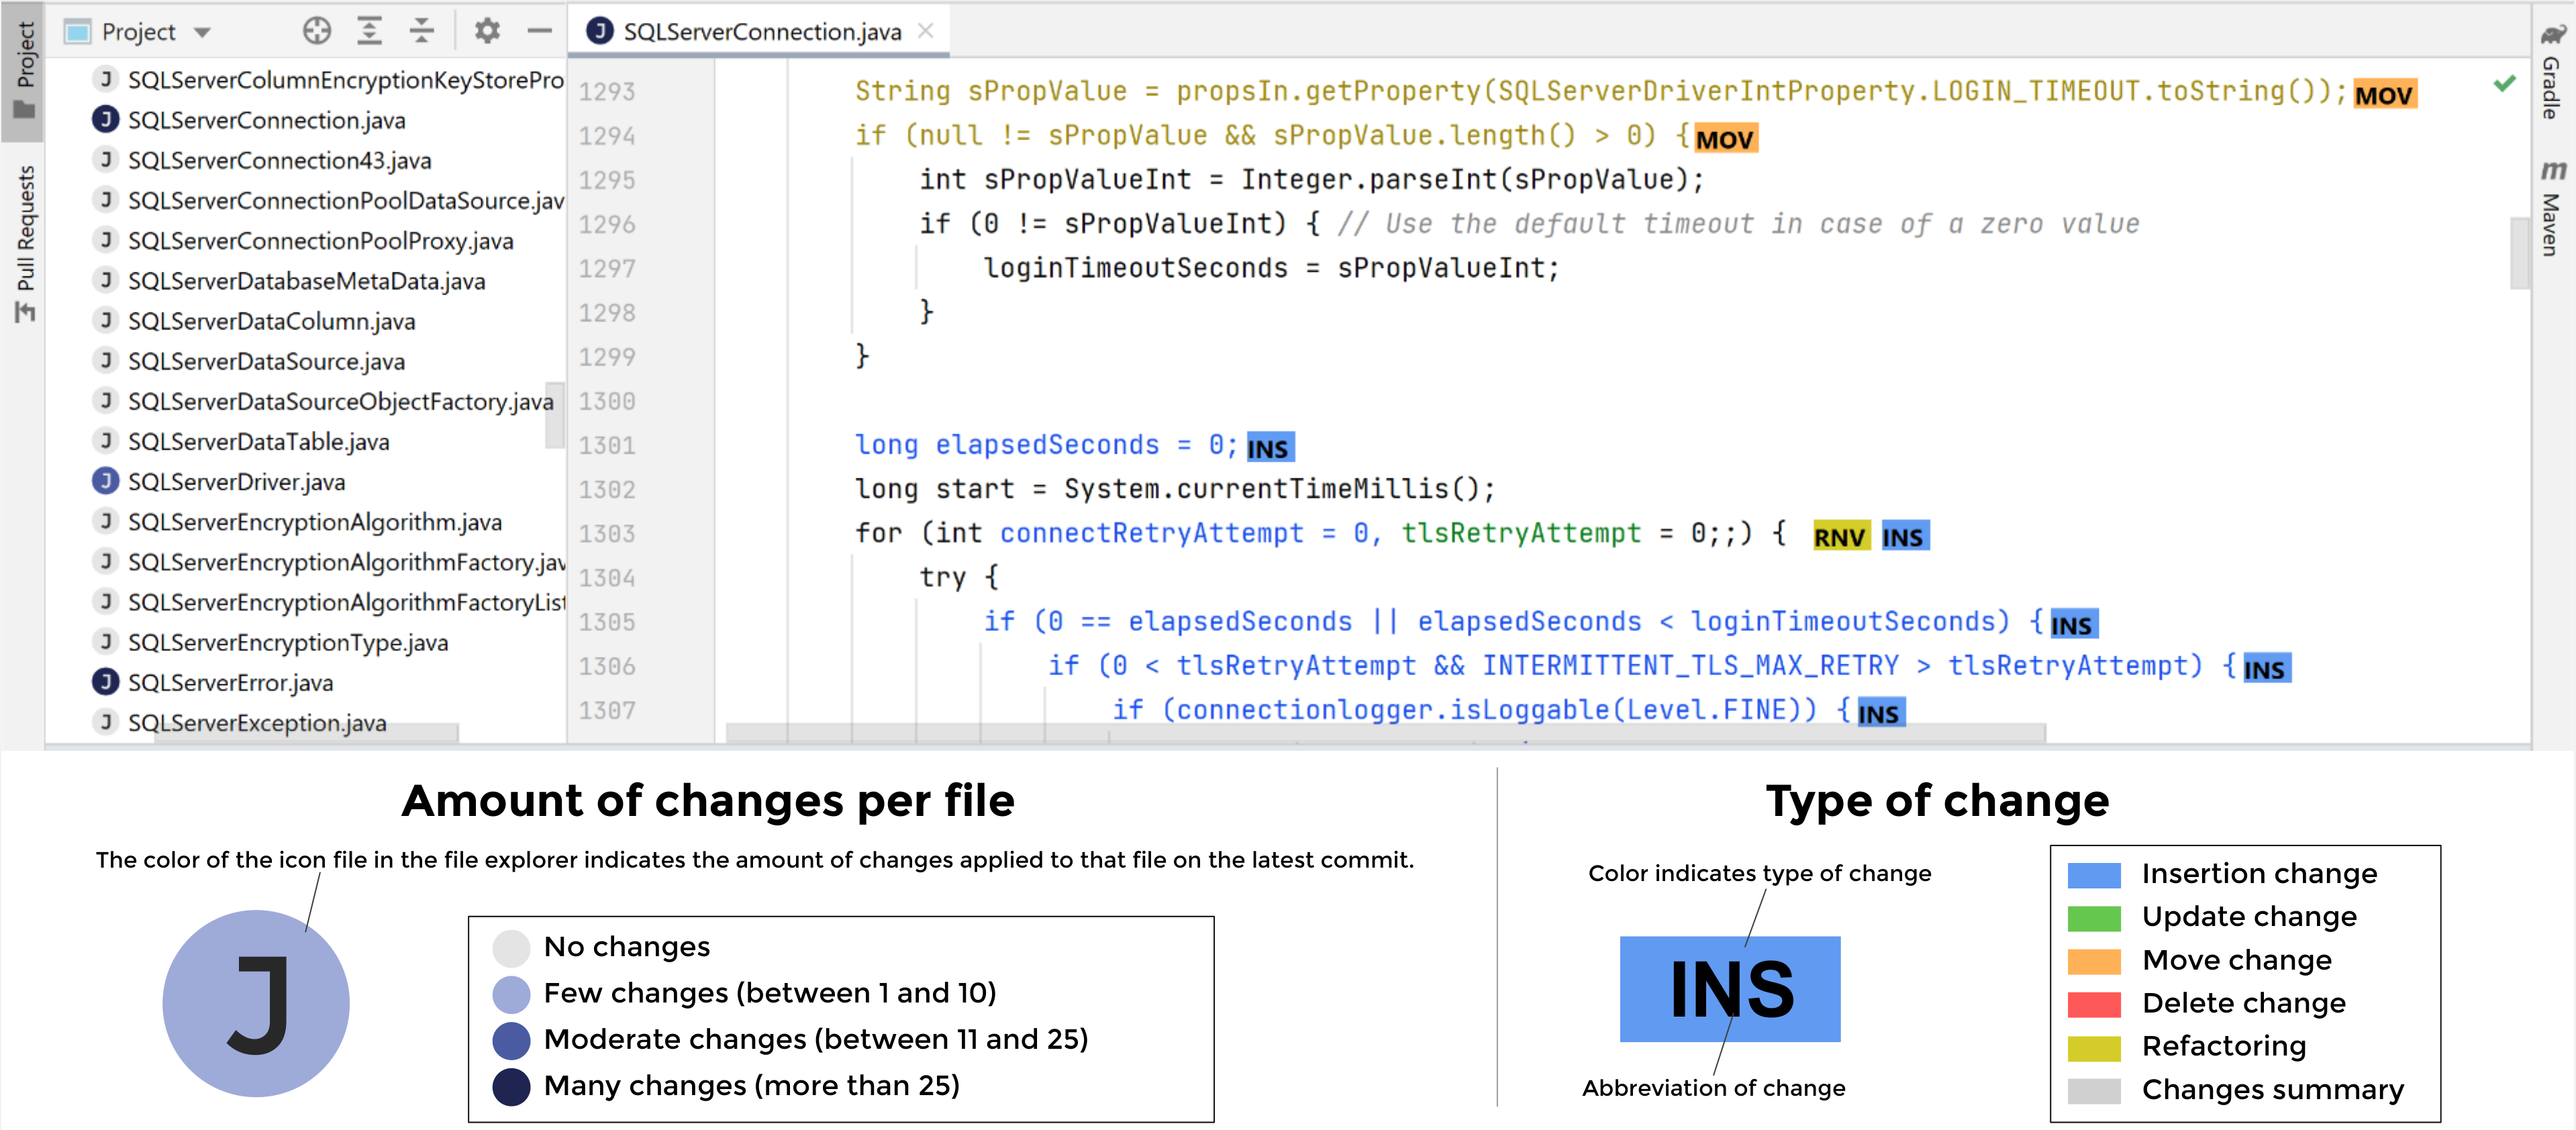
Information about source code changes is important for many software development activities. As such, modern IDEs, including, \emph{IntelliJ IDEA} and \emph{Visual Studio Code}, show visual clues within the code editor that highlight lines that have been changed since the last synchronization with the code repository. However, the granularity of the change information is limited to a line level, showing mainly a small colored icon on the left side of the lines that have been added, deleted, or modified.
This paper introduces Spike, a source code highlighting plugin that uses the font color to visually encode fine-grained version difference information within the code editor. In contrast to previously mentioned tools, Spike can highlight insertions, deletions, updates, and refactorings all in a same line. Our plugin also enriches the source code with small icons that allow retrieving detailed information about a given code change. We perform an exploratory user study with five professional software engineers. Our results show that our approach is able to assist practitioners with complex comprehension tasks about software history within the code editor.
- Tarner, Hagen; Bruder, Valentin; Frey, Steffen; Ertl, Thomas; Beck, Fabian: Visually Comparing Rendering Performance from Multiple Perspectives. In: Bender, Jan; Botsch, Mario; Keim, Daniel A. (Hrsg.): Vision, Modeling, and Visualization. The Eurographics Association, Konstanz, 2022. doi:10.2312/vmv.20221211KurzfassungPDFDetailsBIB Download
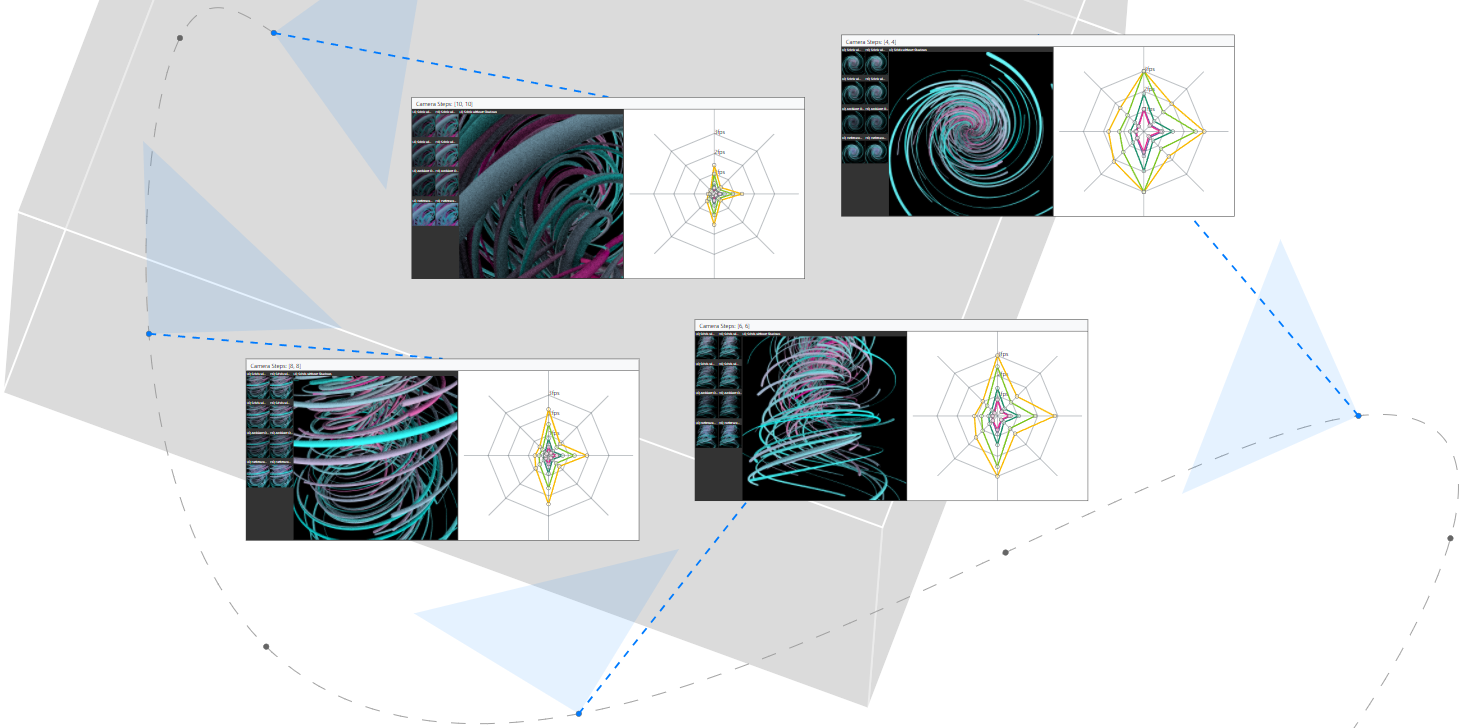
Evaluation of rendering performance is crucial when selecting or developing algorithms, but challenging as performance can largely differ across a set of selected scenarios. Despite this, performance metrics are often reported and compared in a highly aggregated way. In this paper we suggest a more fine-grained approach for the evaluation of rendering performance, taking into account multiple perspectives on the scenario: camera position and orientation along different paths, rendering algorithms, image resolution, and hardware. The approach comprises a visual analysis system that shows and contrasts the data from these perspectives. The users can explore combinations of perspectives and gain insight into the performance characteristics of several rendering algorithms. A stylized representation of the camera path provides a base layout for arranging the multivariate performance data as radar charts, each comparing the same set of rendering algorithms while linking the performance data with the rendered images. To showcase our approach, we analyze two types of scientific visualization benchmarks.


